final class GraphicsGradientFill
package openfl.display
implements IGraphicsFill, IGraphicsData
Available on all platforms
Defines a gradient fill.
Use a GraphicsGradientFill object with the Graphics.drawGraphicsData()
method. Drawing a GraphicsGradientFill object is the equivalent of calling
the Graphics.beginGradientFill() method.
See also:
Constructor
new(?type:GradientType, ?colors:Array<Int>, ?alphas:Array<Float>, ?ratios:Array<Int>, ?matrix:Matrix, ?spreadMethod:SpreadMethod, ?interpolationMethod:InterpolationMethod, focalPointRatio:Float = 0)
Creates a new GraphicsGradientFill object.
Parameters:
type | A value from the GradientType class that
specifies which gradient type to use:
|
|---|---|
matrix | A transformation matrix as defined by the
openfl.geom.Matrix class. The
openfl.geom.Matrix class includes a
|
spreadMethod | A value from the SpreadMethod class that
specifies which spread method to use,
either: |
interpolationMethod | A value from the InterpolationMethod class
that specifies which value to use:
|
focalPointRatio | A number that controls the location of the focal point of the gradient. A value of 0 sets the focal point in the center. A value of 1 sets the focal point at one border of the gradient circle. A value of -1 sets the focal point at the other border of the gradient circle. A value less than -1 or greater than 1 is rounded to -1 or 1, respectively. |
Variables
alphas:Array<Float>
An array of alpha values for the corresponding colors in the colors array. Valid values are between 0 and 1. If the value is less than 0, 0 is used. If the value is greater than 1, 1 is used.
colors:Array<Int>
An array of RGB hexadecimal color values to use in the gradient. For example, red is 0xFF0000, blue is 0x0000FF, and so on. You can specify up to 15 colors. For each color, specify a corresponding value in the alphas and ratios properties.
focalPointRatio:Float
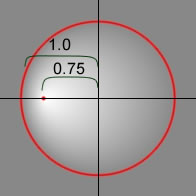
A number that controls the location of the focal point of the
gradient. A value of 0 sets the focal point in the center. A value of
1 means that the focal point is at one border of the gradient circle.A
value of -1 sets the focal point at the other border of the gradient
circle. A value of less than -1 or greater than 1 is rounded to -1 or
1, respectively. For example, the following shows a focalPointRatio
set to 0.75:
interpolationMethod:InterpolationMethod
A value from the InterpolationMethod class that specifies which value
to use. Valid values are: InterpolationMethod.LINEAR_RGB or
InterpolationMethod.RGB
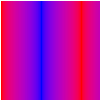
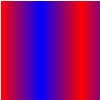
For example, the following shows a simple linear gradient between two
colors (with the spreadMethod parameter set to
SpreadMethod.REFLECT). The different interpolation methods change
the appearance as follows:
InterpolationMethod.LINEAR_RGB | InterpolationMethod.RGB |
|---|---|
 |  |
matrix:Matrix
A transformation matrix as defined by the Matrix class. The
openfl.geom.Matrix class includes a createGradientBox() method to set
up the matrix for use with the beginGradientFill() method.
ratios:Array<Int>
An array of color distribution ratios. Valid values are between 0 and
255. This value defines the percentage of the width where the color is
sampled at 100%. The value 0 represents the left position in the
gradient box, and the value 255 represents the right position in the
gradient box.
Note: This value represents positions in the gradient box, not the
coordinate space of the final gradient which can be wider or thinner
than the gradient box. Specify a value for corresponding to each value
in the colors property.
For example, for a linear gradient that includes two colors (blue and
green) the following example illustrates the placement of the colors
in the gradient based on different values in the ratios array:
ratios | Gradient |
|---|---|
[0, 127] |  |
[0, 255] |  |
[127, 255] |  |
The values in the array must increase sequentially; for example, [0,
63, 127, 190, 255].
spreadMethod:SpreadMethod
A value from the SpreadMethod class that specifies which spread method
to use. Valid values are: SpreadMethod.PAD, SpreadMethod.REFLECT,
or SpreadMethod.REPEAT.
For example, the following shows a simple linear gradient between two colors:
import openfl.geom.*;
import openfl.display.*;

var fillType = GradientType.LINEAR;
var colors = [0xFF0000, 0x0000FF];
var alphas = [1, 1];
var ratios = [0x00, 0xFF];
var matr = new Matrix();
matr.createGradientBox(20, 20, 0, 0, 0);
var spreadMethod = SpreadMethod.PAD;
graphics.beginGradientFill(fillType, colors, alphas, ratios, matr, spreadMethod);
graphics.drawRect(0,0,100,100);
This example uses SpreadMethod.PAD for the spread method, and the
gradient fill looks like the following:
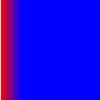
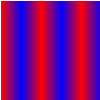
If you use SpreadMethod.REFLECT for the spread method, the gradient
fill looks like the following:
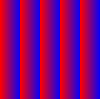
If you use SpreadMethod.REPEAT for the spread method, the gradient
fill looks like the following:
type:GradientType
A value from the GradientType class that specifies which gradient type
to use. Values are GradientType.LINEAR or GradientType.RADIAL.